“Haugh Model and Modification” took second place for the 2019 Boit Prize for Engineering Writing, one of the Ilona Karmel Writing Prizes.
I. Introduction
Human growth hormone (hGH) is a peptide hormone that is required for several important signaling pathways in the human body, including cellular growth and metabolism. These pathways also promote aging, genomic instability, as well as impacting sleep cycles (Guevara-Aguirre 2011). Consequently, an understanding of the interaction between hGH and its receptor protein on the cell surface is vital.
hGH has two binding sites, site 1 and site 2, and both sites bind to the same receptor. This signaling acts through receptor homodimerization. However, each site has a different affinity for the receptor. Site 1 has a much higher affinity for the hGH receptor than site 2. The sequence of reactions can then be stated as followed. hGH binds to a receptor on the cell surface at site 1. The unbound site 2 of hGH in this complex then binds to another receptor on the cell surface, forming a homodimer made of 1 hGH protein and 2 receptors. This dimer then promotes downstream signaling pathways by recruiting Janus kinase 2 (Jak2) tyrosine kinases to other receptors.
The pathway is more complex and involves many other cellular mechanisms, involving internalizations of cell-surface proteins, recycling of internalized receptors, and synthesis of receptors. The model developed by Jason M. Haugh was created to incorporate these ligand and receptor trafficking mechanisms (Haugh 2004). He sought to match dose response data reported in literature by modeling proliferation signal depending on the amount of hGH introduced to the cell, as well as including the ability to model and predict inhibition and different mutations in hGH. Rate constants used in this model were determined from previous literature and by adjusting the parameters so as to minimize the differences between the model and raw data. Initial conditions were set at 2000 receptor proteins per cell. Consequently, the model developed accurately represented the raw data and predicted limitations.
II. Model
The Haugh model uses 4 ordinary differential equations to calculate dimer formation and thus signaling. The ODEs used describe the hGH receptors on the cell surface (R), the complexes bound to site 1 of hGH on the cell surface (C), dimers made of 1 hGH and 2 receptor proteins (D), and internalized receptor proteins (Ri) (Figure 1B). The ODEs account for receptor and complex endocytosis, internalized receptor recycling, receptor degradation, and binding at the cell surface (Figure 1A). Dimer degradation is assumed to happen the instant a dimer is internalized, captured in the rate constant ke. Rate constants used were of that in the Haugh paper.
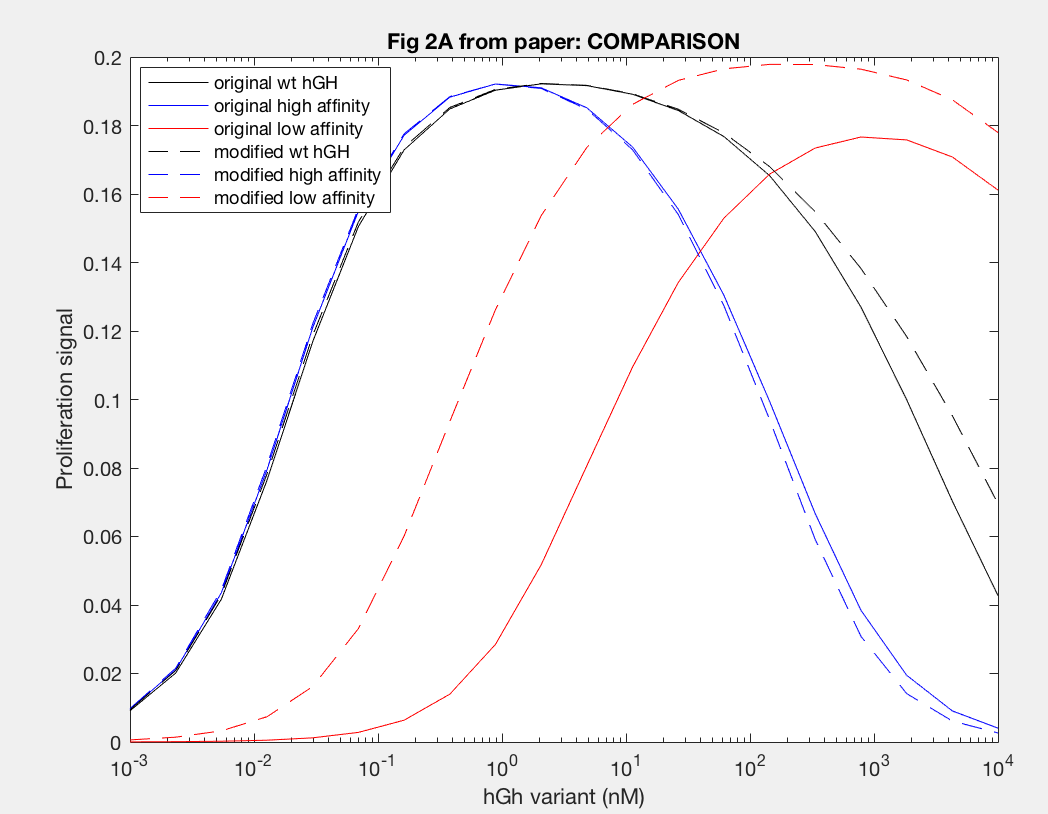
The model was successfully used to describe the effect of changing the affinity of site 1 in hGH on the proliferation signal produced, calculated as per equation A5 in the Haugh model (Figure 2). As expected, the general shape of the curve is a bell curve; the proliferation signal increases as hGH concentration increases because dimer formation increases, until so much hGH is added that instead of forming dimers, multiple hGH proteins bind receptors at site 1, which has a higher affinity for the receptor. When the affinity of site 1 is mutated to be higher (blue dashed line), the maximum proliferation signal is about the same, but the range of hGH variant that can hold that maximum decreases (Figure 2). This happens because as hGH increases, because the affinity at site 1 is higher the protein is more inclined to bind at site 1. When site 1 affinity is decreased (red dashed line), the maximum proliferation signal decreases, but this maximum is achieved at much higher concentrations of hGH (Figure 2). This is because with a lower affinity, the protein is not pushed as hard to bind at site 1, so more hGH must be added to force multiple hGH proteins to be bound only at site 1.
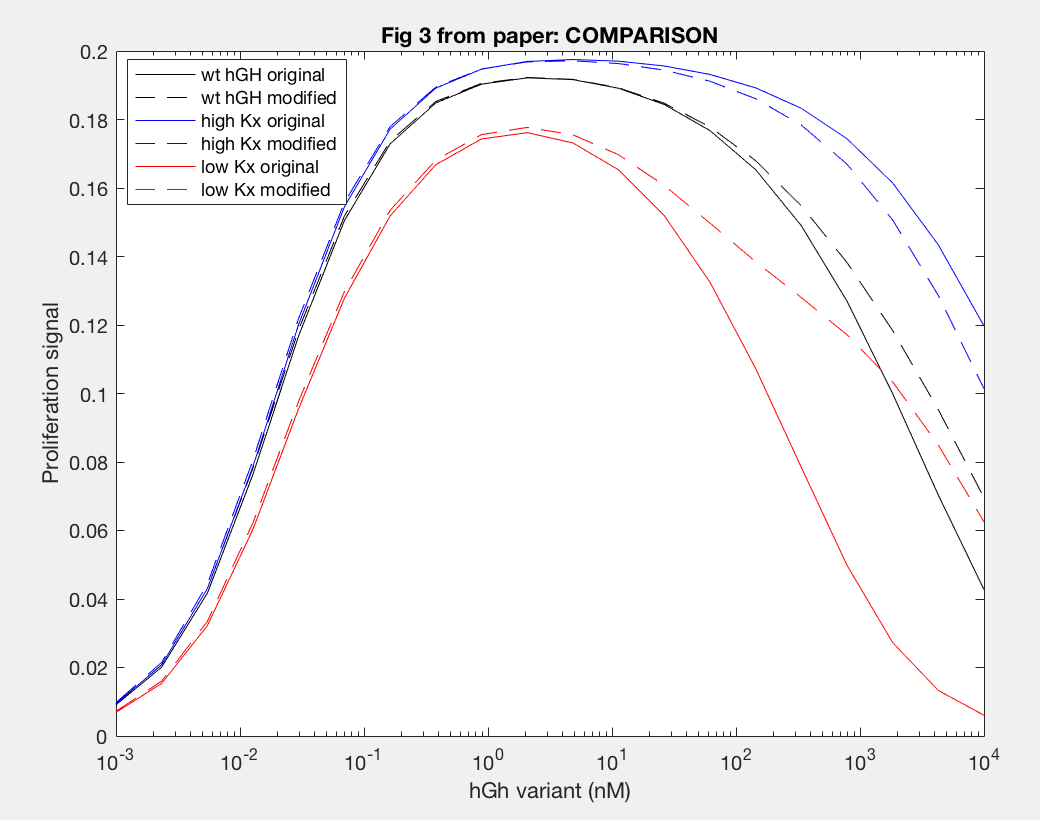
Similarly, the model was also able to predict the effect on proliferation signal by changing the site 2 affinity for the receptor by changing the value of the rate constant kx2 (Figure 4). Increasing the affinity by a factor of 10 (dashed blue line) relative to wildtype hGH resulted in a slightly increased maximum proliferation signal because this is the rate constant leading to dimer formation, thus at steady state more dimer can be formed (Figure 4). The higher affinity also allowed the maximum proliferation signal to be achieved for a greater range of hGH variant concentration because it increased the likelihood of hGH binding two receptors. Decreasing the affinity of site 2 for the receptor by 10-fold (dashed red line) similarly decreases the maximum proliferation rate and the range of hGH concentration this maximum can be held out for. However, both variants and wildtype hGH reach their maximum proliferation signal at 1 nM hGH (variant), indicating that changing the affinity of site 2 does not have an impact on the amount of hGH required for maximum dimer formation.
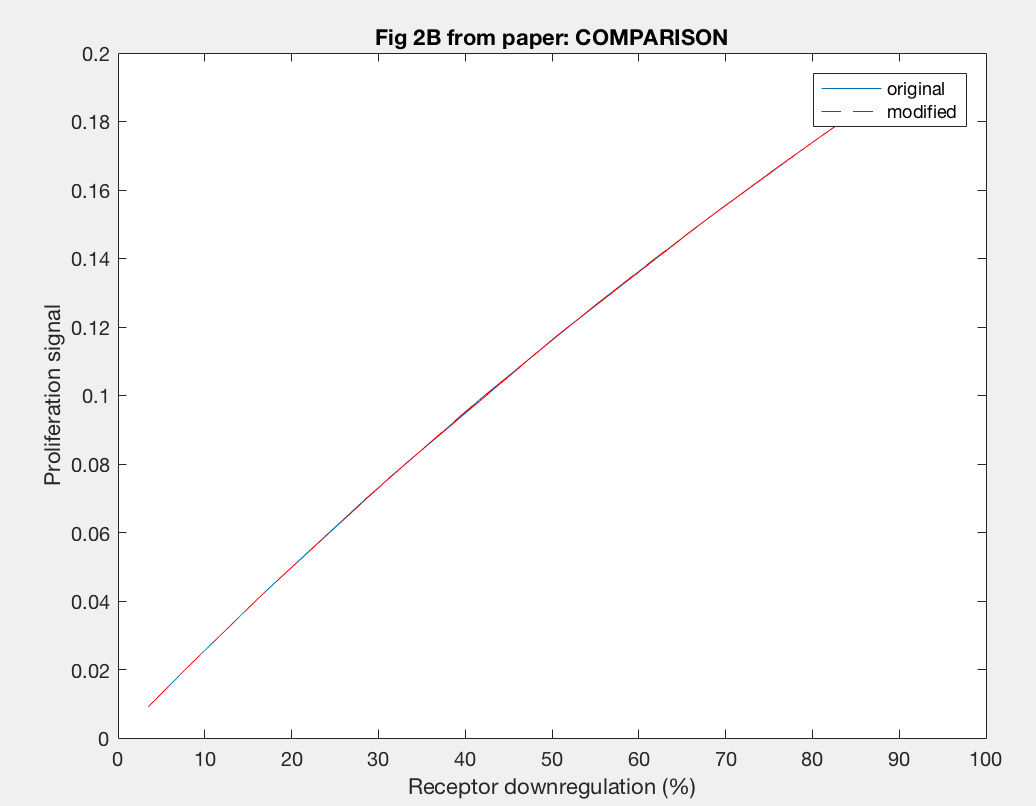
The model was also able to predict the relationship between proliferation signal and receptor downregulation, which was almost linear (Figure 3). This means that as the dimers forming increases, there is a linear increase in proliferation signal. This conclusion can help in interpreting other results as well, by drawing the relationship between dimer formation and signaling.
Antagonistic effects of hGH variants were also successfully described by implementation of the Haugh model (Figure 5). Antagonism by K172A/F176A (blue line) showed that much higher levels of hGH variant needed to be added to decrease proliferation signal, as expected because the affinity of K172A/F176A is about 650x lower than the site 1 affinity of wildtype hGH. A defective site 2 of the hGH antagonist showed a decease in proliferation signal at lower concentration of hGH variant, because of the inability of the antagonist to dimerize (red and yellow lines). Furthermore, a higher site 1 affinity of the antagonist was confirmed to decrease dimerization as lower concentrations of hGH as seen in the difference between H21A/R64K/E17A/G120R and G120R (red and yellow lines).
Using anti-hGH antibodies, Fab fragments were also modeled as antagonists because of their inability to form dimers (Figure 7). Proliferation signal was calculated for different concentrations of Fab 5 (red line) and Fab 13E1 (blue line), and Fab 5 decreases proliferation signal (and thus dimerization) at lower concentrations of Fab than Fab 13E1. Fab 5 antagonism decreases the kx2 of hGH binding rather than inhibiting, which proved to be a more dramatic antagonistic effect because kx2 is the only rate contributing to dimer formation.
Furthermore, the agonistic effect of anti-hGH antibodies as monoclonal antibodies, or MAbs, on the proliferation signal was also demonstrated by the model (Figure 6). MAb 5 (purple line) cannot form dimers, so the proliferation signal was always 0. MAb 3D9 (yellow line) and 263 (red line) both reach their maximum proliferation signal at 10 nM MAb, which indicates that the fact both have the same site 1 affinity is important to when max proliferation occurs. However, the maximum proliferation signal with MAb 263 is much higher than that of MAb 3D9, indicating that higher rate constants, like kf1 and kx2, result in increased dimerization. MAb 13E1 (blue line) has the highest proliferation signal but requires a higher MAb concentration, indicating that a higher KD needs a higher MAb concentration for maximum dimerization and confirms that a higher kf1 and kx2 result in increased dimer formation.
Dimer fraction versus time and hGH concentration was also calculated using the Haugh model and gave expected results (Figure 6).
The model employed several key assumptions upon implementation. To begin with, hGH was assumed to have been in excess, so that [L] ~ [L]0. This assumption is valid because enough hGH (or hGH variant) is added to the system to be able to ignore ligand depletion, and was confirmed to cause no change in proliferation signal by the simple addition of a differential equation (Figure 9A). Additionally, the internalized pool of receptors was ignored by setting the krec/kdeg fraction to 0; thus, krec = 0 and the value of kdeg is irrelevant. This assumption serves to simplify the model but may not be as accurate a representation of signaling as it could be. Furthermore, the model depends upon receptor proteins and complexes being internalized at the same rate, as well as dimers being degraded upon internalization at a different rate.
The model also makes several assumptions about the binding of hGH to the receptor proteins. Haugh assumes that hGH first binds at site 1, which makes sense because this site has a higher affinity. The model also depends upon site 1 dissociating to break up the dimer, followed by the “fast” dissociation of hGH and receptor protein at site 2.
ODEs were written using standard mass action methods, indicating an assumption that the solution is well-mixed (although a common assumption, this may not be the most accurate representation).
Although several assumptions were made and many rate constants fit to the data, the model well represented the data and gave insight into the mechanism.
III. Conclusion
Generally, the Haugh model fit the data provided. However, this good fit was brought about by starting with rate constants determined by data, and then “adjusting” them to give a better fit—essentially fitting the data, which takes away from the significance of how good the fit is. Additionally, while the ODEs incorporated recycling and degradation of internalized receptor, krec was set to 0, which neglected this entire portion of the model. This means that the entire point of modeling receptor protein is mute and leaves a huge hole in what this model could do. There is also room for improvement in the basic assumption of the solution being well-mixed, where one could factor in different compartments. Furthermore, the representation of the dissociation of the complex formed after dissociation of the dimer, i.e. receptor bound to hGH at site 2, as “fast” leaves room for modification. What exactly is “fast,” how can that truly be modeled, and what is the mechanism behind it?
That being said, the assumptions made allowed for the model to be easily (more or less) implemented to provide insight into the mechanism, including what rate constants were important, how binding sites affected signaling, and antagonist agonist by anti-hGH antibodies. Without the simplifications made by Haugh, this model would have been at worst impossible and at best much more complex to implement and understand, and could have less significance in determining the mechanisms at play.
IV. Modification
The Haugh model presents an opportunity for modification where it models the irreversible dissociation of the complex formed upon dissociation of the dimer (receptor bound to hGH at site 2) as “fast.” “Fast” is not a rate and is likely missing steps in between, and no truly irreversible reaction exists in biology. This modification incorporates reversible dissociation of the dimer to form a second complex (C2), where receptor protein is bound to site 2 of hGH, which can also reversibly dissociate to unbound receptor and ligand (Figure 10A). This model accounts not only for reversible reactions and a more specific method of dimer formation and dissociation but also for the binding of receptor protein to the lower-affinity site 2 of hGH first. This modification is an important addition because it provides another mechanistic insight and possible explanation; even if it does not prove to be as accurate as the Haugh model, it could be adjusted and applied to other mechanisms. The ODEs used to implement the modification can be found in Figure 10B. I hypothesize that this modification will as a general trend increase the dimer formation and thus proliferation signaling.
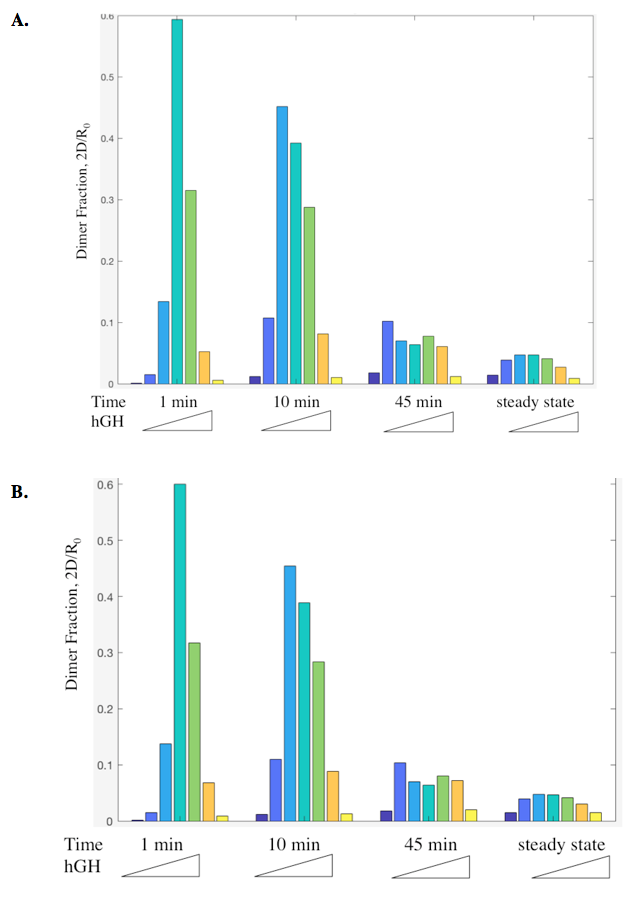
The actual results of the implementation of the modified model proved to be more complex than my simple hypothesis. The modification has no noticeable effect on the dimer fraction formed at different time points and hGH concentrations (Figure 11). Additionally, the relationship between receptor downregulation and proliferation signal remains the same, but this makes sense as it only shows the relationship between dimer and signaling (Figure 12).
However, once the changes in the affinities of the binding sites are modeled, we see interesting changes with the modification. With site 1, with a higher affinity the modification does not change the initial increase in proliferation signal at lower concentrations of hGH variant or the maximum cell proliferation. However, the modification does change the range of hGH concentration that this maximum can be held for (Figure 13). At a higher affinity, the modification shortens it, but at a lower affinity the modifications lengthens this range. Furthermore at a low site 1 affinity, the modification increases both the range of hGH concentration at maximum proliferation signal as well as increases the maximum proliferation signal.
Analysis of site 2 affinity reveals an analogous trend. The modification did not impact the increase in proliferation signal as hGH concentration increases at low concentrations, which makes sense because the modification includes site 2 affinity binding for dimer formation, but that does not greatly impact formation since the affinity is lower than that of site 1. However, at high kx2 values, the modification decreases the range of hGH variant that achieve maximum proliferation signal, while at low values of kx2 this range is increased. Perhaps at high values of kx2 although more dimer could potentially be formed, more dimer could dissociate through the modified mechanism.
Although the results did not necessarily agree with my hypothesis, they brought about interesting insight that could prove useful in future modeling.
V. Figures
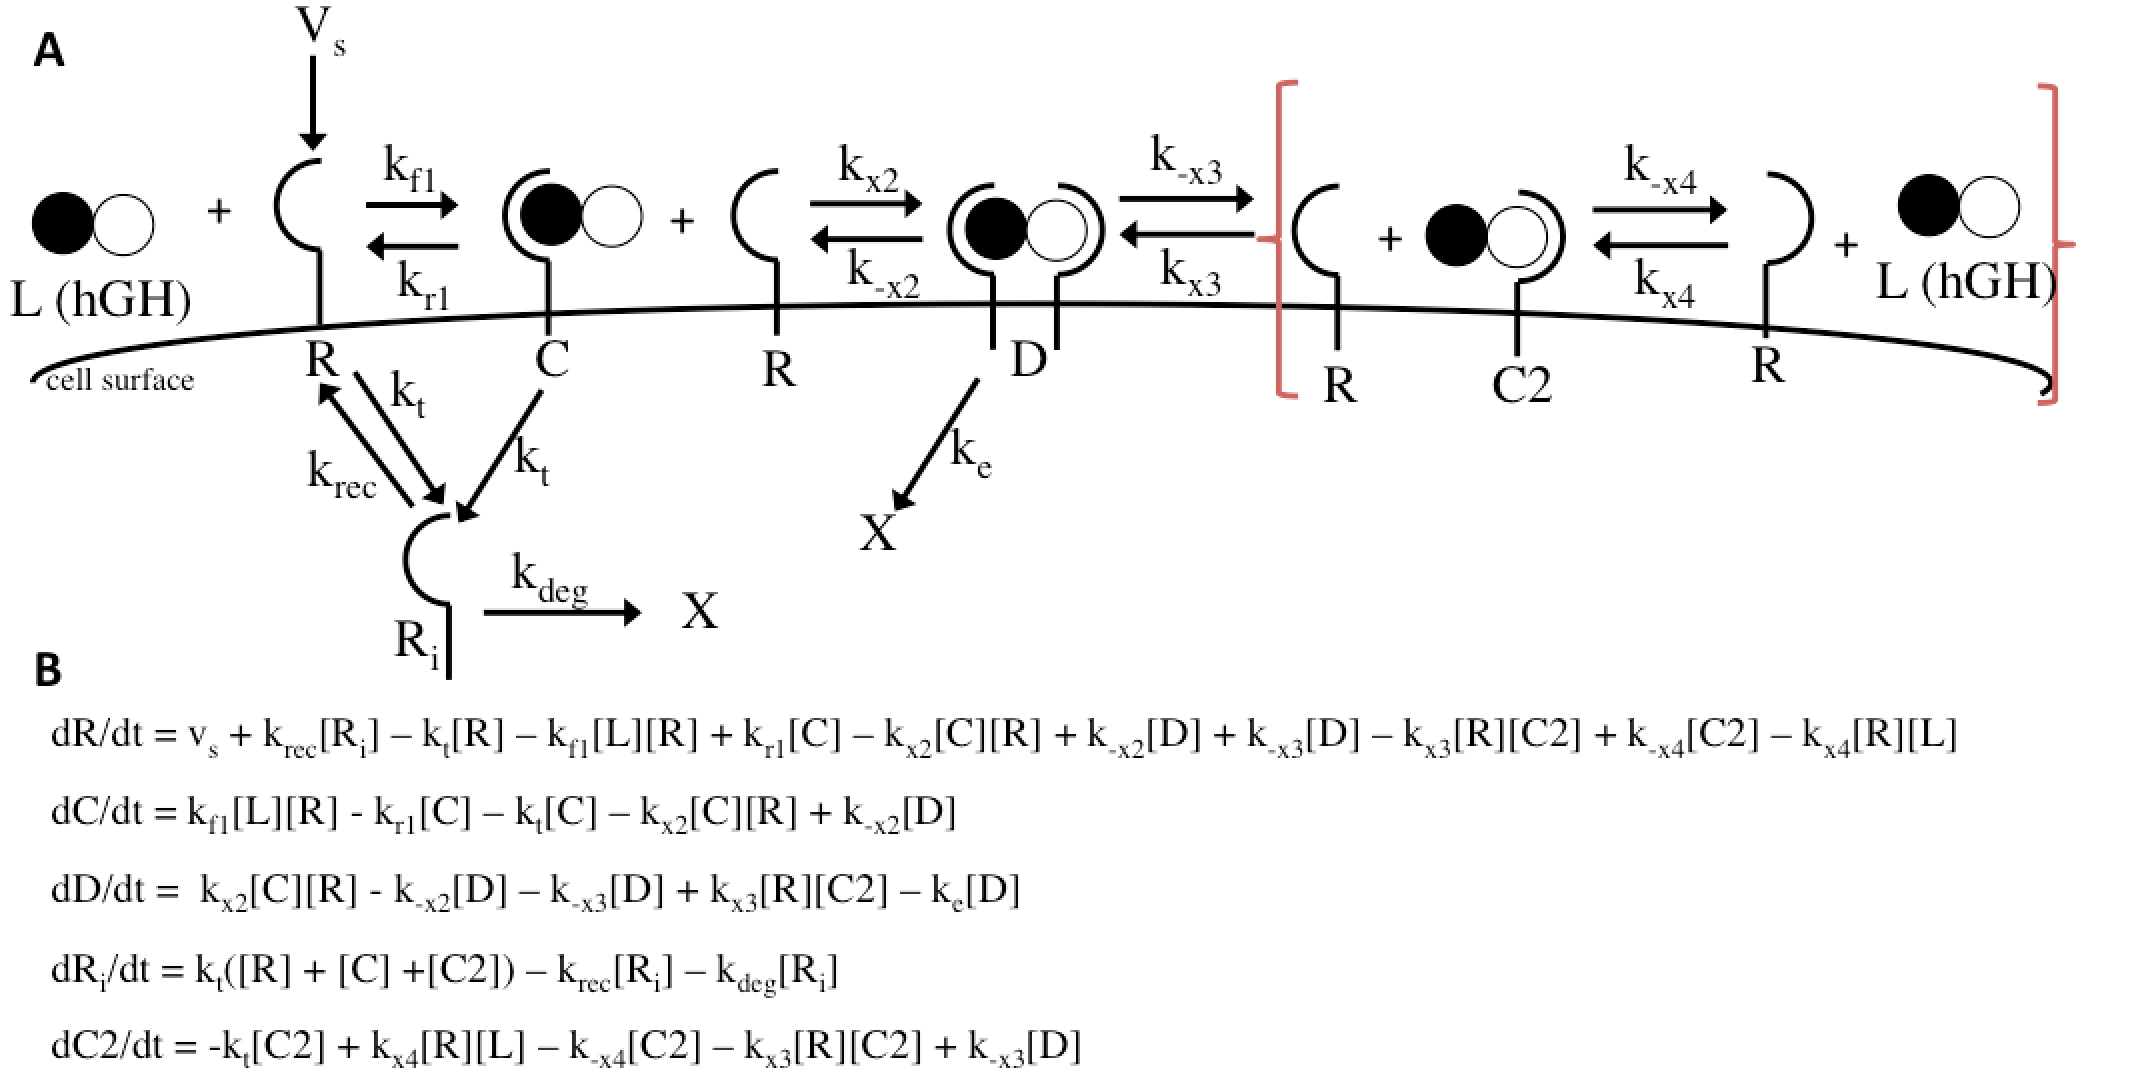
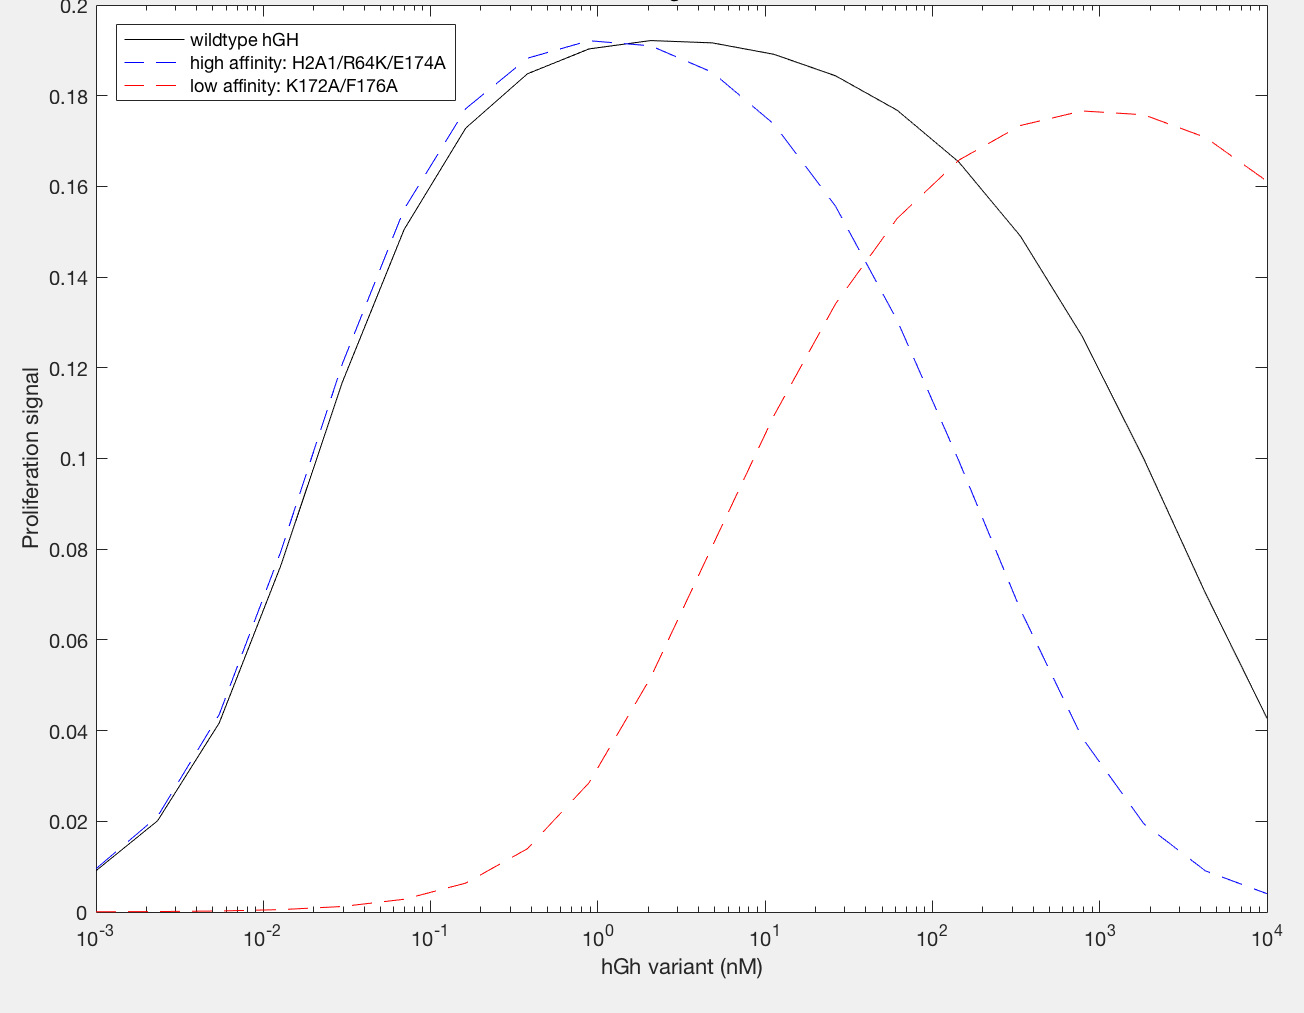
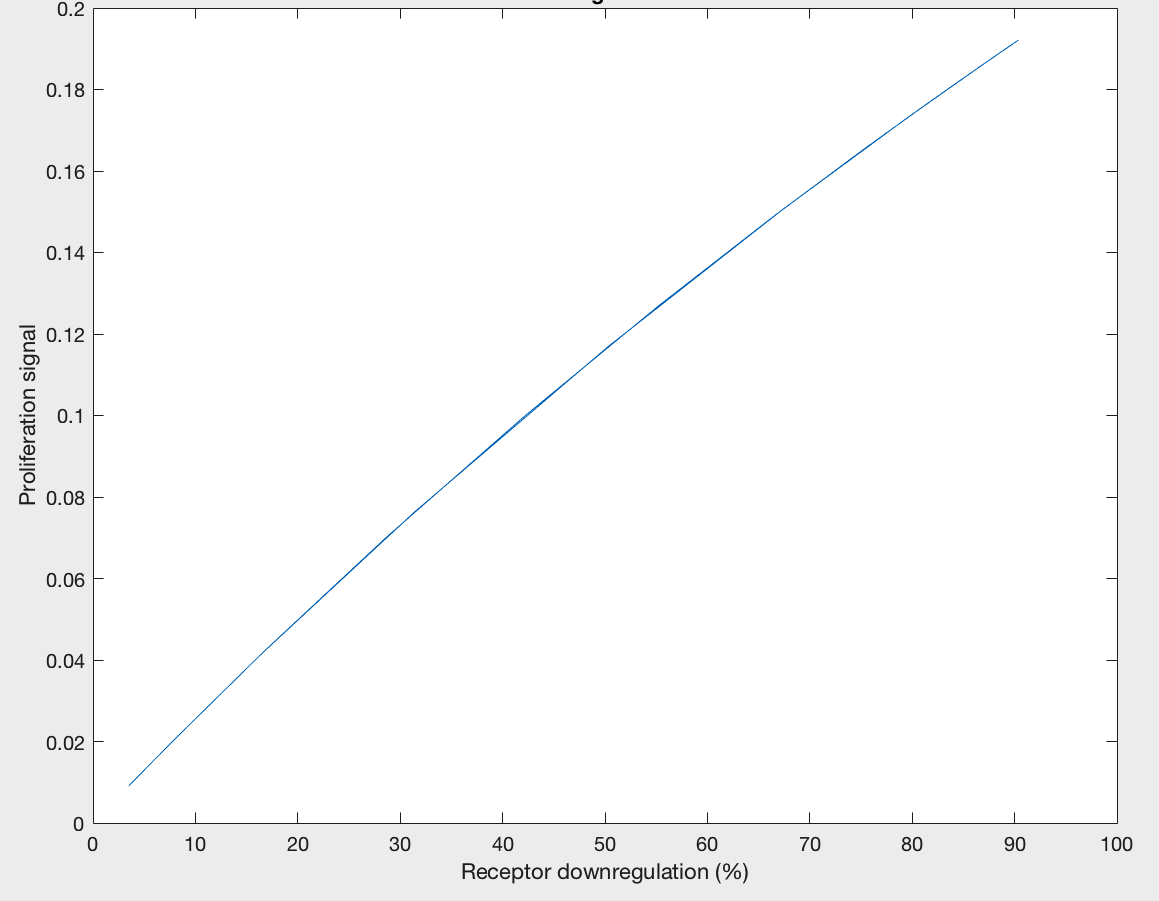
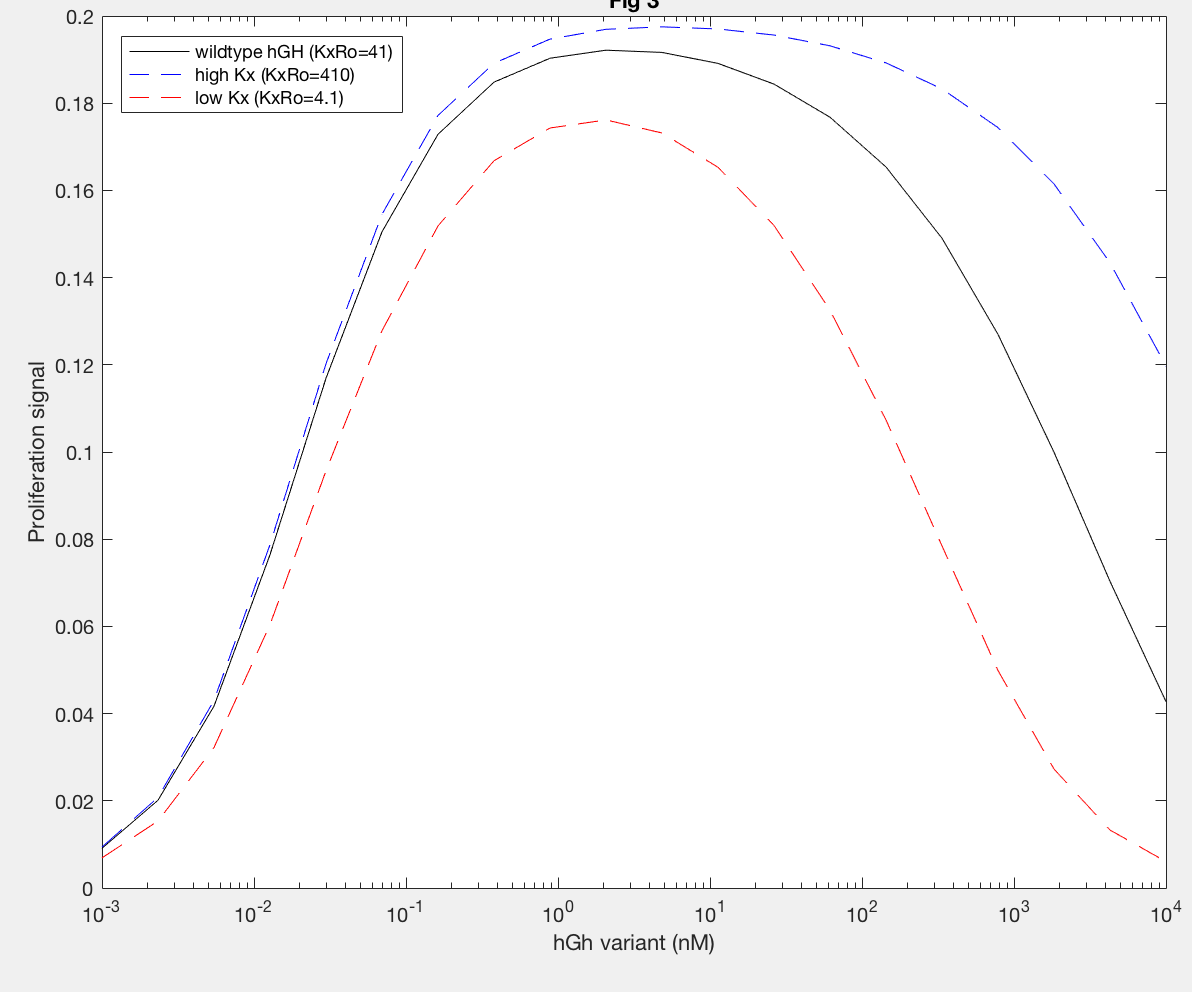
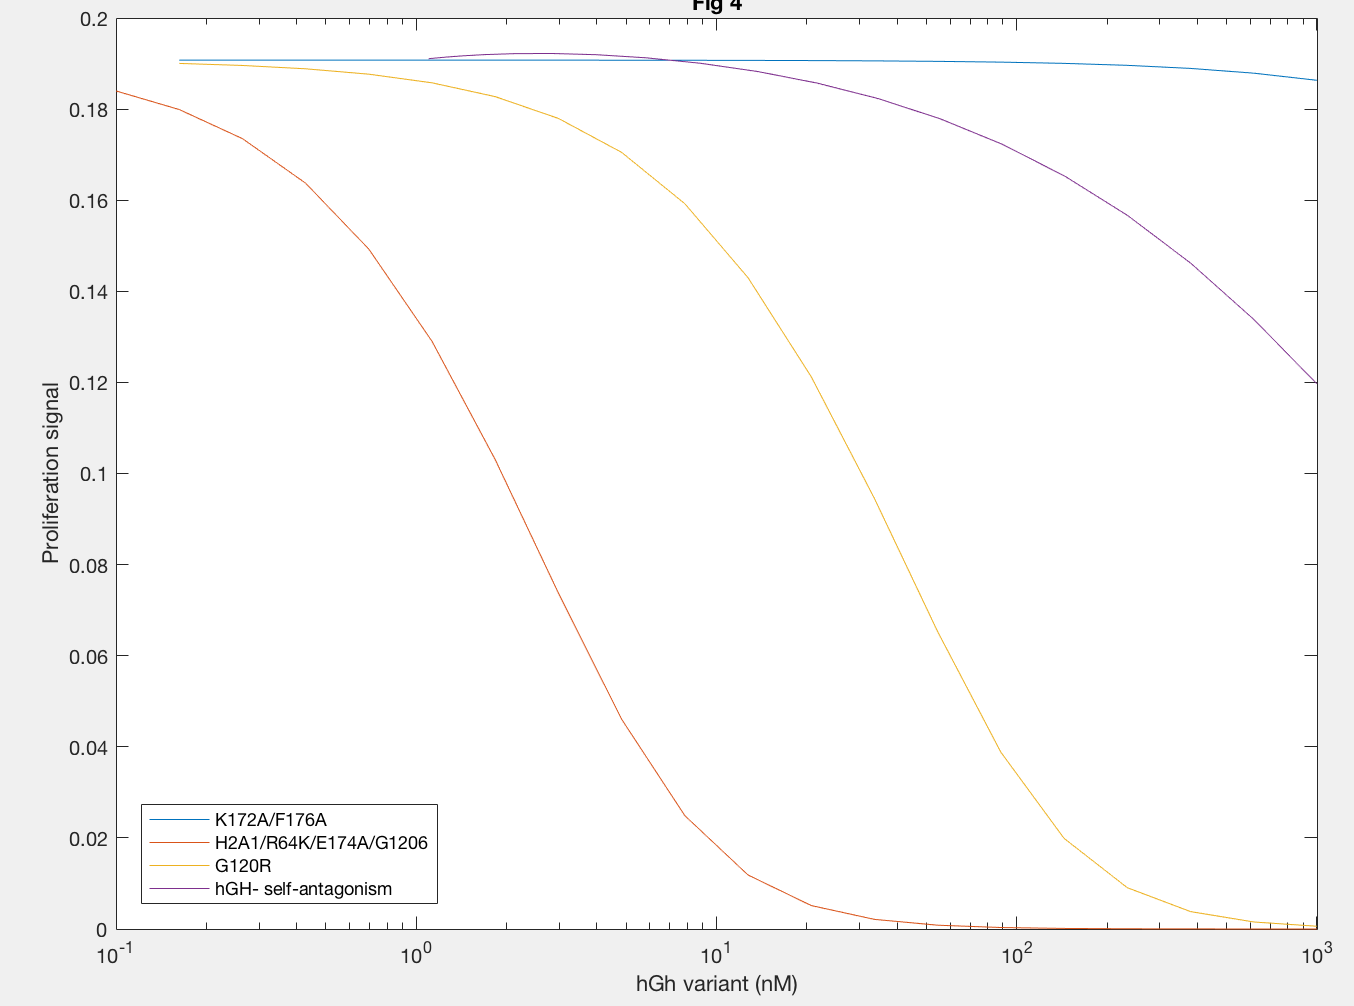
Figure 6A.
hGH variant (nM)
| Antibody | kf1 | kr1 | kx2 | k-x2 | k-x1 |
| 13E1 | 0.0024 | 0.042 | 0.0108 | 0.0042 | 0.0042 |
| 263 | 0.006 | 0.03 | 7.95×10^(-4) | 0.003 | 0.003 |
| 3D9 | 0.002 | 0.01 | 2.04×10^(-5) | 0.001 | 0.001 |
| 5 | 0.004 | 0.002 | 0 | 0.002 | 0.002 |
Figure 6B.
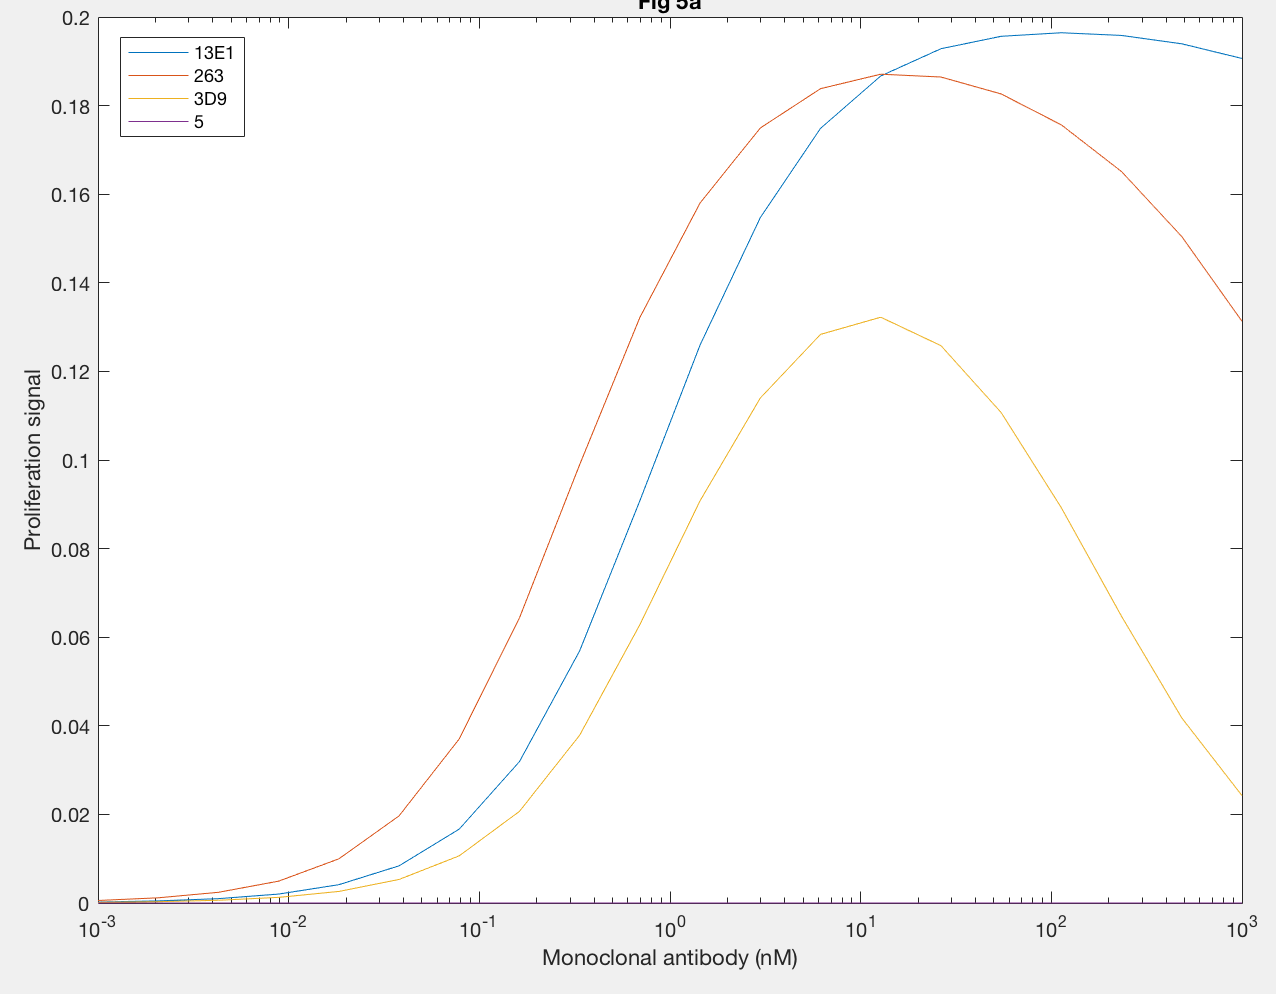
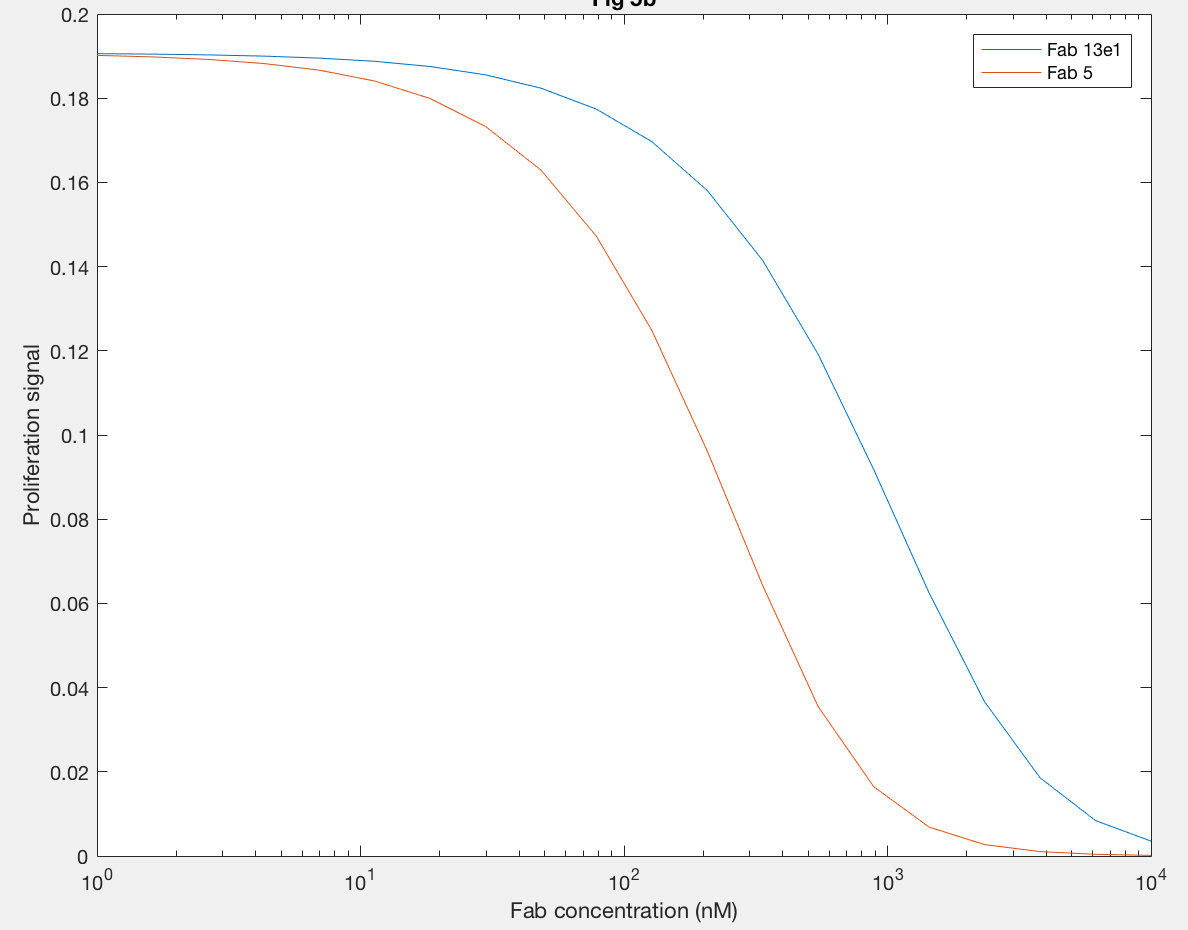
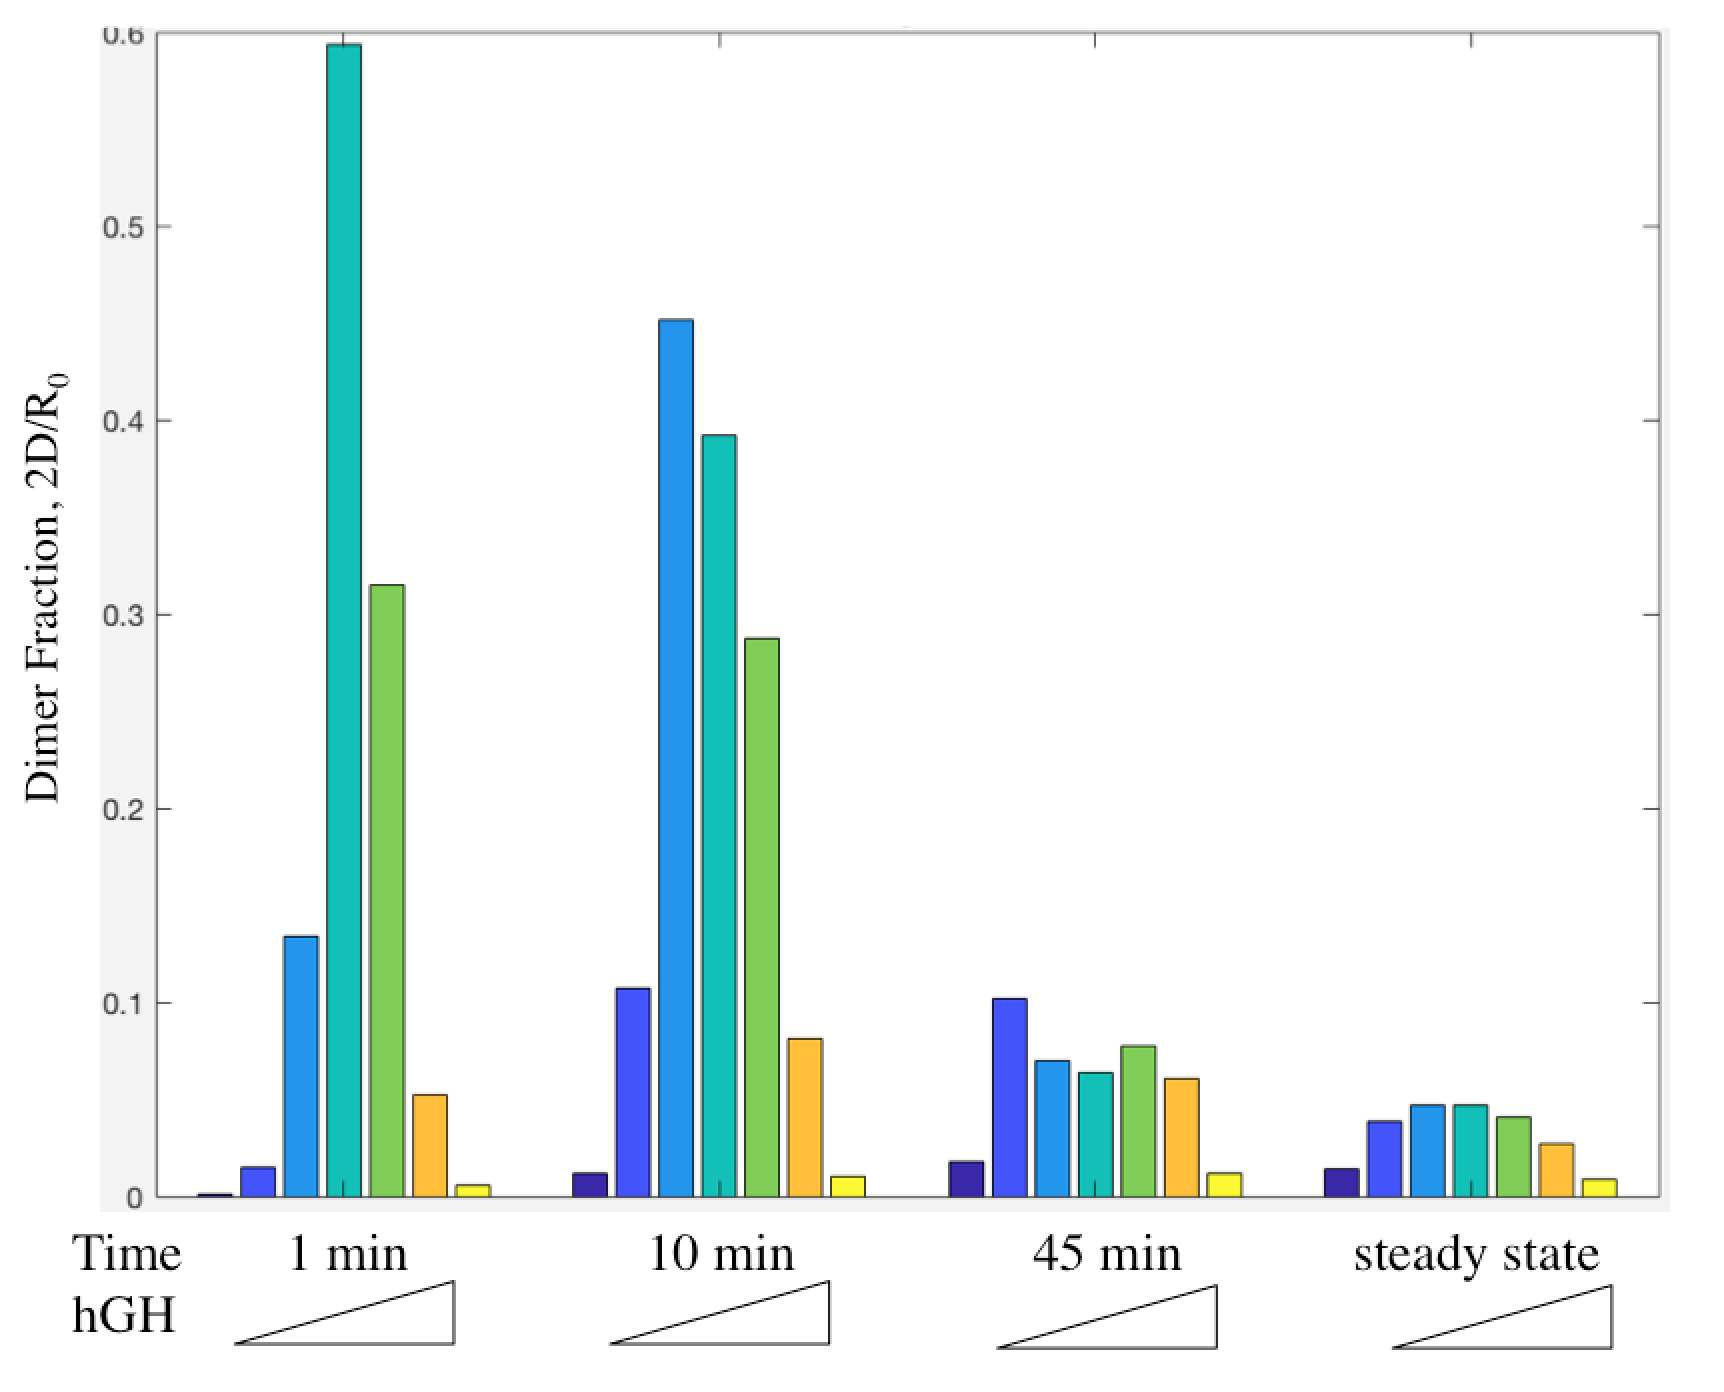
Figure 9A.
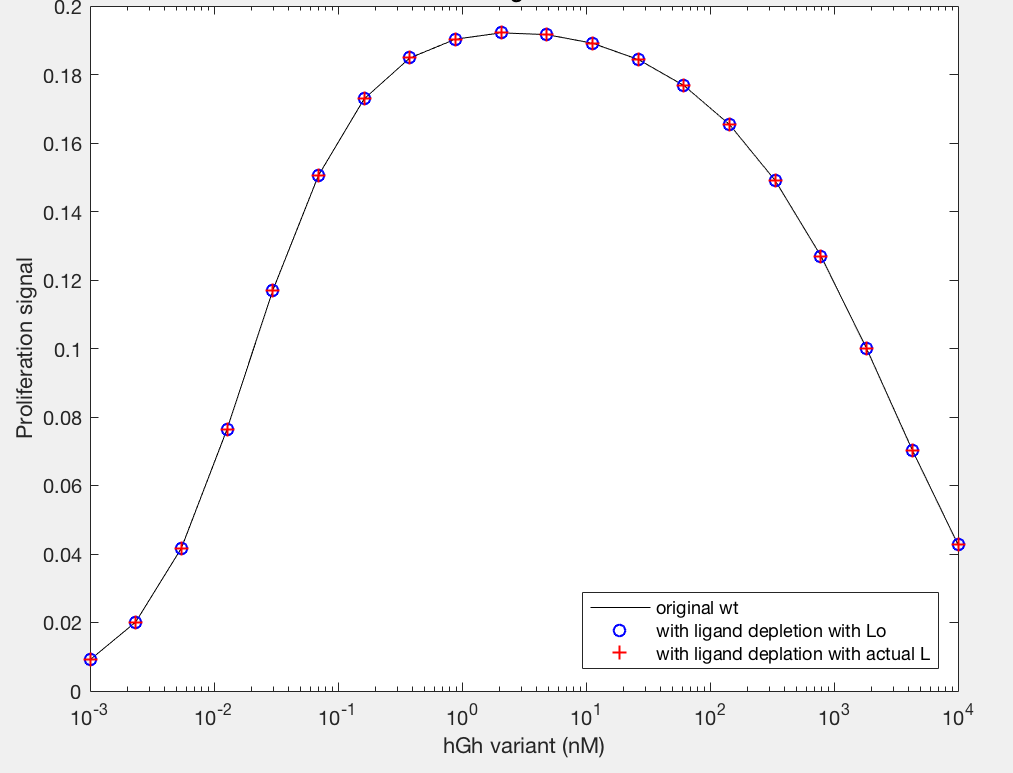
Figure 9B.
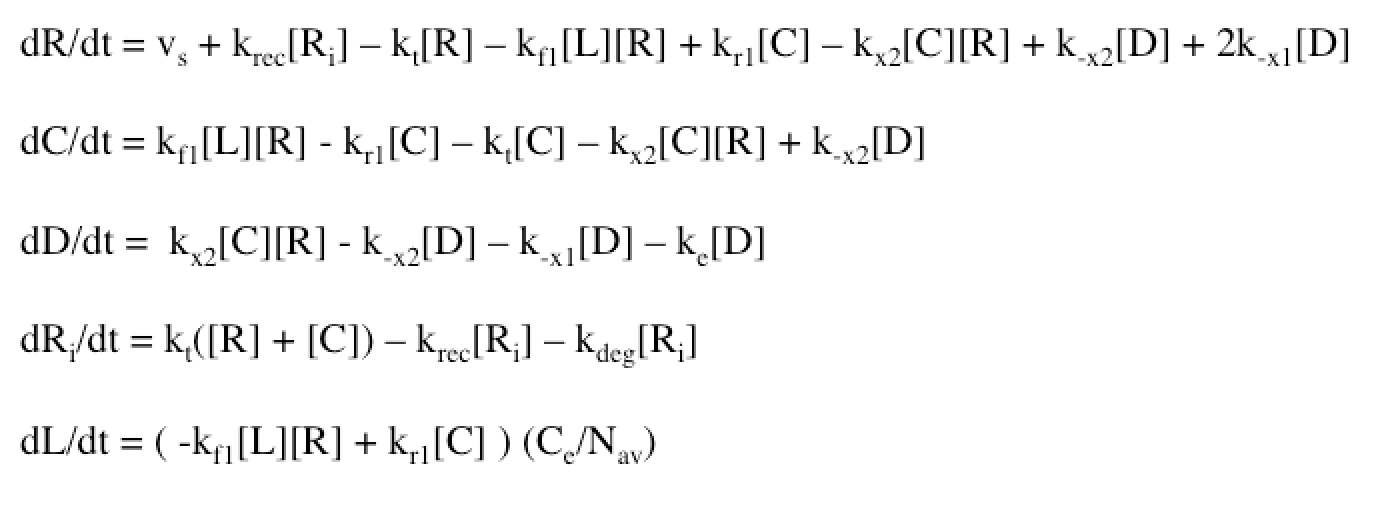

Figure 11
References
Jason M. Haugh. “Mathematical Model of Human Growth Hormone (hGH)-Stimulated Cell Proliferation Explains the Efficacy of hGH Variants as Receptor Agonists or Antagonists.” Biotechnology Progress 20 (2004): 1337-1344.
Jaime Guevara-Aguirre, Priya Balasubramanian, Marco Guevara-Aguirre, Min Wei, Federica Madia, Chia-Wei Cheng, David Hwang, Alejandro Martin-Montalvo, Jannette Saavedra, Sue Ingles, Rafael de Cabo, Pinchas Cohen, Valter D. Longo. “Growth Hormone Receptor Deficiency Is Associated with a Major Reduction in Pro-Aging Signaling, Cancer, and Diabetes in Humans.” Science Translational Medicine 3 (2011): 1-9.